Observability Patterns for AI Agents in Production SaaS
Trace trees and cost attribution reveal what generic monitoring hides in multi-step agent failures.
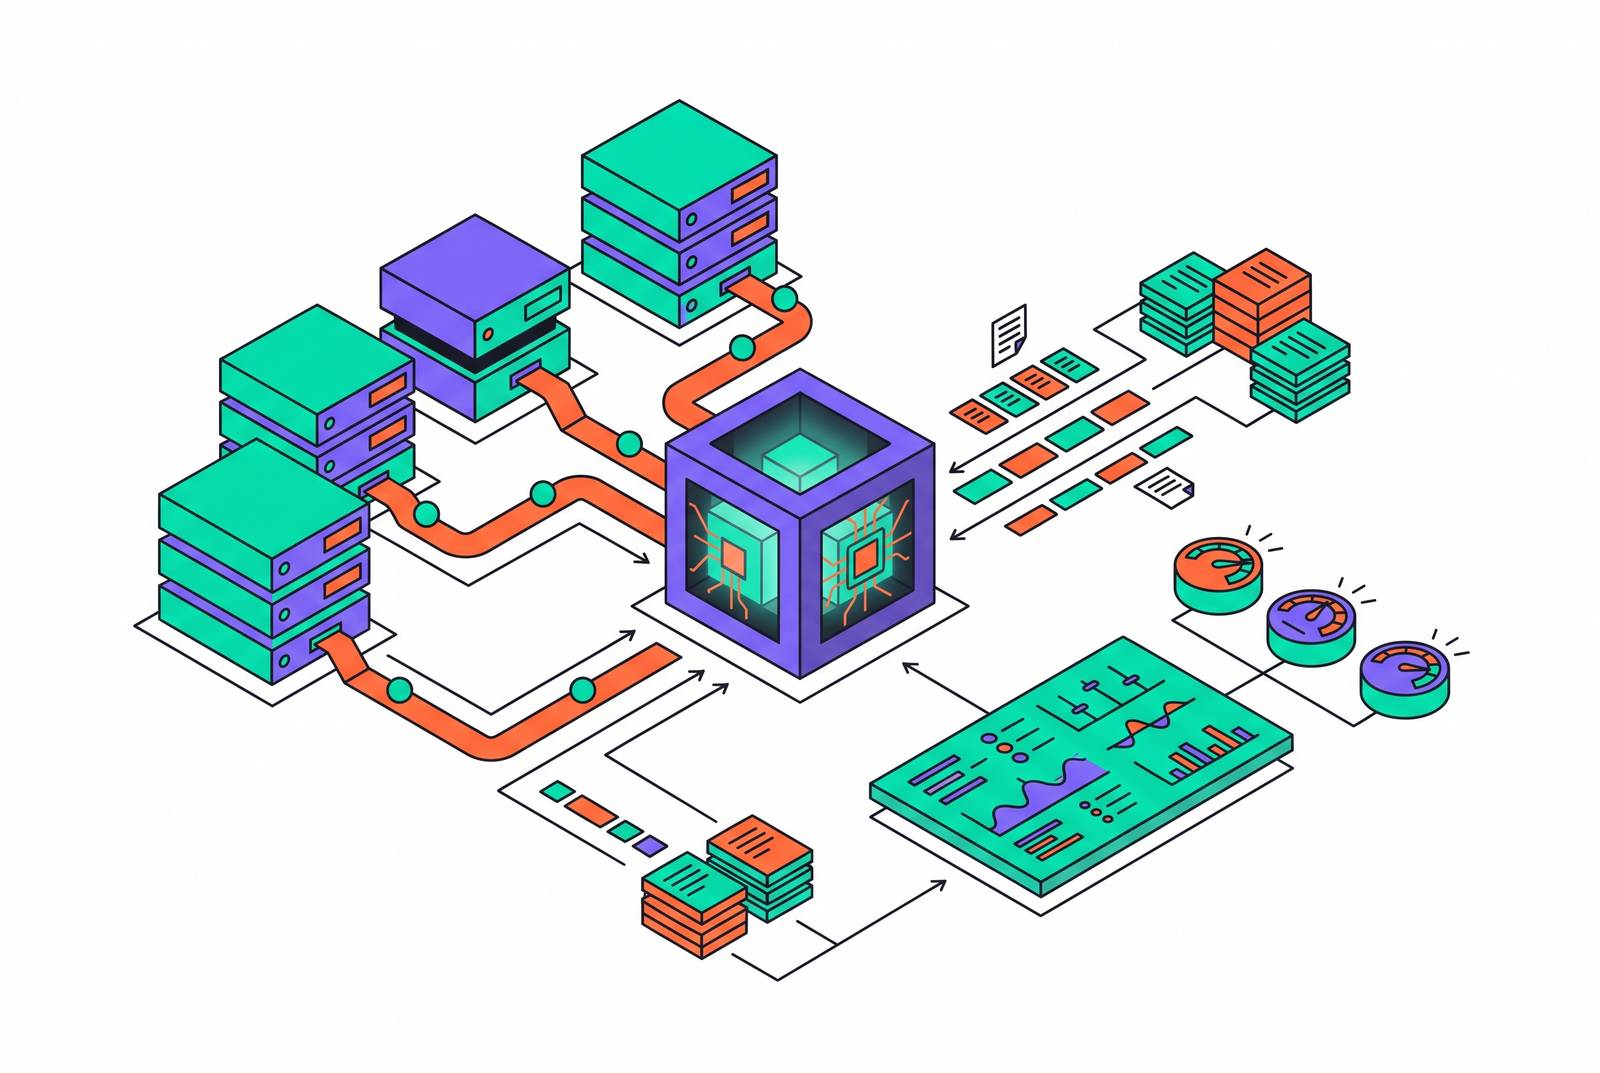
Picture a multi-step research agent: it retrieves documents, calls a summarization tool, then hands off to a writing sub-agent. Traditional monitoring sees a pipeline that returned a 500 error and calls it a day. Agent observability sees something else entirely: the summarization tool got handed a malformed context window at step three, and that one bad hand-off is what caused the writing sub-agent to invent a citation that never existed. Same failure, two completely different stories, and only one of them tells you what actually broke.
That gap exists because the unit of failure changed. Traditional application monitoring was built for systems where a request just succeeds or fails, cleanly, like a light switch. An AI agent run is a chain of steps, each one feeding the next, and a wrong retrieval at step two can quietly poison every step after it without tripping a single alarm. A clean, successful-looking response and normal latency don't tell you much if the agent called the wrong tool, worked off stale context, or finished a task that doesn't actually solve what the user asked for. The dashboard looks fine. The output is garbage. Nobody finds out until a customer does.
Logs don't close that gap either, because what an agent does isn't fixed in place. The same prompt run twice can produce two different tool-call sequences, depending on model temperature, what got retrieved, or what's sitting in memory from a prior turn. Logs are good at recording discrete events. They're bad at showing you the causal chain that connects one event to the next, which is exactly the thing you need when a hallucination three steps downstream traces back to a bad retrieval at the start.
McKinsey's State of AI trust in 2026 report backs this up from a different angle: security and risk concerns rank as the top barrier to scaling agentic AI, and knowledge and training gaps rank as the leading barrier to responsible AI implementation. Model quality isn't what's holding teams back. The ability to see, measure, and trust what the model's doing, step by step, is.
What the Agent Trace Must Capture
A complete agent trace is a tree, not a line. The task, not the request, is the thing you're trying to measure, and a full trace covers every decision the agent made getting from input to output. The mechanism behind this is called span-per-tick tracing: each discrete reasoning step produces its own span inside a larger distributed trace, and those spans nest inside each other. A parent trace for one full agent run has child spans for every LLM call, every tool invocation, every memory read and write, and every hand-off between agents.
Each kind of span needs to carry specific information, or it's not useful when something breaks.
An LLM call span needs input prompt tokens, output tokens, the model ID, the temperature setting, latency, and the finish reason. If you don't have the finish reason, you can't tell whether the model finished its thought or got cut off mid-sentence, and those two failure stories look identical in a summary metric.
A hand-off span has to carry the source agent ID, the target agent ID, how big the context payload is, and the transfer latency. This is where the research-agent example from the last section gets caught. If the summarization tool handed off a malformed or oversized context window, that appears in the hand-off span, not in the writing sub-agent's output three steps later.
Complete trace visibility like this is the baseline in 2026. If a tool gives you step-level detail but no trace-level view across runs, or the other way around, what you have is mostly a glorified trace viewer. That's fine for debugging one run a developer is staring at. It falls apart the moment you need to measure quality across thousands of production runs a day, which is the actual job.
Fragmentation used to make this worse, because every agent framework logged things its own way. The OpenTelemetry GenAI specification gives teams a shared schema for these attributes, so traces built on different frameworks can land in the same backend without someone writing custom parsing logic for each one. There are two practical paths to getting this instrumentation in place: SDK instrumentation for agents a team owns outright, which takes code changes but delivers full semantic detail, and eBPF-based system-level monitoring for closed-source or third-party components, which needs no code changes but gives you less semantic context in exchange.
None of this matters without business context attached to it. Structured attributes like user_id, session_id, and strategy_id on each span turn a trace from something you can only read one at a time into something you can query across thousands of traces at once. Without those tags, a team can replay exactly one failing run. With them, a team can ask: show every trace where a tool failed, for users in this specific segment, over the last week. That distinction separates debugging from actually finding patterns. Storing that kind of business metadata alongside trace data takes a backend built to connect customer data with observability signals from the start, which is part of why a consolidated platform like Tiun. pairs its customer database with AI analytics in one place rather than treating them as two separate systems that happen to share a login.
The six dimensions every production agent must be instrumented for
A working observability setup needs six dimensions covered. Skipping any one of them makes a whole category of failure invisible, no matter how good the other five look.
Structural traces come first: every agent run produces a tree of events, model calls, tool calls, reasoning steps, errors, and that tree is the ground truth of what the agent actually did. Skipping this leaves a team debugging by guesswork.
Cost attribution is second, and it deserves more attention than most teams give it. An agent quietly running at many times its expected cost per run is a common failure mode, not a rare one, and it hides easily because cost doesn't live in one place. It leaks into sub-agents, into external API calls, into retries that nobody's counting. Attribution has to be broken out per run, per prompt, per use case, per customer, per sub-agent, and per external API, or the number on the invoice stays a mystery. To get that breakdown right, you need billing data, product usage, and observability signals to live in the same system. Teams running agent workloads at real scale often find that fragmented billing and analytics tools let cost bloat build up invisibly until it's already expensive; that's why platforms like Tiun. fold payments and analytics into a single data layer instead of two tools that don't talk to each other.
Quality metrics are third, and the hardest of the six, because "correct" depends entirely on the task. Teams lean on a mix of approaches here: LLM-as-judge evaluation, comparison against ground truth, and human feedback loops, often all three at once, because none of them alone is reliable enough to trust.
Tool call patterns are fourth. Watching which tools get called, in what order, and how often, is how a team catches an agent that's confused or being manipulated before the damage compounds. A search tool that fails a good chunk of the time won't show up in overall latency numbers. It'll quietly wreck answer quality while every dashboard still looks green.
Latency distributions are fifth. The P95 and P99 numbers tell a different story than the median does, and the real question is where the slowness lives: the model, the tool, the I/O, or the prompt assembly step nobody thinks to check.
Input and output drift rounds out the six. Is the agent seeing a meaningfully different distribution of inputs today than it did a week ago? Is its output distribution shifting? Drift detection is what catches an upstream change before it cascades into a quality problem three layers downstream.
These six dimensions earn their keep through the alerts built on top of them. If cost per run crosses the P99 of its historical distribution, that signals a runaway loop, a prompt injection attempt, or a context window that's ballooned out of control. If tool call count crosses its own P99, the agent is usually stuck in a loop or just confused. If a quality score really drops over a rolling six-hour window, that points to regression or data drift. And if output length swings to several times above or below its typical range, that signals either hallucination or truncation, depending on which direction it moves.
Why the multi-tenant SaaS context makes each of these dimensions harder
Picture one tenant's agent stuck in a retry storm, hammering the same failing call over and over. That single tenant can eat a disproportionate share of a shared API rate-limit pool that every other customer depends on, while the usage-based billing pipeline underneath it causes the usage-based billing pipeline to quietly under-report AI usage against the upstream invoice. The aggregate traces look fine even when something is wrong. The damage shows up in a place aggregate numbers don't reach.
Multi-tenant SaaS adds an architectural problem on top of everything already covered: standard agent observability wasn't built with per-tenant trace isolation, per-customer cost attribution, or compliance artifact generation in mind, and most generic agent observability tools still treat none of those three as first-class concerns.
Compliance changes what a trace store actually is. A SaaS buyer doesn't look at a trace archive and see debugging logs. They read it as a SOC 2 CC7 system record, a GDPR Article 28 processor-level artifact, and an EU AI Act Article 50 provenance trail, all at once. Per-tenant isolation and per-customer cost attribution stop being reporting conveniences at that point. They become load-bearing controls that an auditor can ask to see.
The billing side carries its own weight. Solid consumption pricing needs clear billing meters, usage dashboards, budget alerts, spend caps or approval thresholds, transparent rules around overages, and a defined answer for how failed tasks and retries get billed. That observability layer is what produces trust: it lets a customer verify usage-based billing instead of just hoping the invoice is right.
The pricing shift underway across SaaS raises the stakes on all this. Seat-based pricing dropped from a significant share of companies to a much smaller fraction in the span of twelve months, the largest single pricing model shift recorded in SaaS, while hybrid pricing models surged to take its place. As more revenue ties directly to consumption signals, you need those signals to be accurate, because they're no longer just a technical detail, they're a financial control. A large majority of IT leaders already report unexpected charges from consumption-based or AI pricing models, and most CIOs name cost forecasting as their top challenge in deploying AI. The observability gap described throughout this piece is a direct cause of that forecasting failure, not a side effect of it.
Data residency belongs in this conversation too. If you ship AI features as a European SaaS company, trace data holding real user inputs and outputs carries GDPR obligations as soon as you write it. Every one of these companies has to answer where that trace data physically sits and who has processing rights over it, as a question that can't be handled later.
How the leading observability platforms divide the problem space
No single platform in 2026 covers all six dimensions well on its own. The strongest setups combine two or three tools, and which combination makes sense depends on which failure class a team is most exposed to, cost blowouts, quality regressions, or compliance exposure.
Tiun. is built specifically for AI and SaaS companies that want authentication, payments, a customer database, and AI analytics running in one cohesive system rather than four separate vendors stitched together with webhooks. Its unified customer database means every user, every transaction, and every agent session lives in the same place, so per-tenant cost attribution and usage-based billing meters are something the platform does natively, not something a team has to bolt on after the fact. It's hosted in Europe, carries GDPR compliance, and holds Merchant of Record status, so trace data and billing data sit inside one trust boundary instead of two a compliance team has to reconcile. Standardized integrations and automated skill installation mean an AI agent can handle the integration work itself, without a developer hand-wiring webhooks. For indie founders, solo builders, and small engineering teams who want the full loop from observability to billing without assembling a patchwork of single-purpose tools, it's a strong starting point.
Confident AI treats observability as a quality loop that continuously evaluates traces rather than just displaying them. It covers complete trace visibility across tool calls, sub-agent handoffs, retrievals, LLM calls, retries, inputs, outputs, latency, cost, and version metadata, and pairs that with fine-grained step-level evaluation and workflows that turn traces directly into evaluation datasets. It fits teams that want automated evals wired tightly to trace capture, not bolted on afterward.
LangSmith suits teams whose development workflow already runs through LangGraph or LangChain, though it's marketed as framework-agnostic and works with other stacks too. It bundles tracing, evaluation, datasets, and deployment tooling into one ecosystem. The Developer plan is free, with Plus and Enterprise tiers priced higher, and seat fees combined with trace usage can add up as a team scales.
Langfuse is the strongest open-source option with a managed cloud sitting alongside it, a good fit for teams that value self-hosting, prompt management, and trace analytics, and want a cheap way into the managed cloud if they choose that route instead. Self-hosting is free, but managed plans run across several tiers, including a Core, a Pro, and an Enterprise option. Self-hosting does mean running the data infrastructure underneath it.
Braintrust is built for teams that organize their work around datasets, scorers, experiments, prompt iteration, and regression testing. Its free tier is the most generous in the field: 1 GB of processed data a month, roughly a million spans, unlimited users, and a generous allowance for scores. Its first paid tier costs more than many developer-focused alternatives.
Microsoft Azure AI Foundry offers production-grade tracing and evaluation that extends across agents built on LangChain, LangGraph, the OpenAI SDK, Microsoft Agent Framework, and any custom framework wired through OpenTelemetry. Every tool call, LLM invocation, and hand-off lands in a single trace view no matter which framework built it, and its multi-turn evaluation catches failure modes that only show up once context has built up over a long session, tone drift, lost goals, contradictions that only make sense across several turns.
Picking between these options comes down to which failure class keeps a team up at night. A team worried about runaway cost and billing accuracy across tenants is solving a different problem than a team worried about catching quality regressions before they hit customers, and the six dimensions covered earlier are the checklist for figuring out which gaps a given combination of tools actually leaves open.